


 54 / 116

54 E L EC TR I C AL CONNEC T I ON
AU T UMN 20 1 7
LEADING THE CHARGE
T
he important difference between
charging for substations or for
electric traction is time.
In many traction applications,
recharging a battery is compared to
filling up quickly with combustible fuel; in
substations, time is not an issue.
Lead-acid batteries are used in both
areas, but lithium-ion batteries by virtue
of their superior energy density are
highly desirable for vehicles requiring an
extended operating range.
However, the complexity of multi-cell
battery packs takes away some of that
inherent advantage. When it comes to
testing, lithium-ion makes sense for
stationary applications but is complicated
for vehicles.
SUBSTATIONS
Without emergency power, substations
would be severely compromised.
Protective relays may require
emergency electrical supply in case of
blackouts, but that is low-power stuff.
Operating isolating switches and circuit
breaker trip coils requires more power.
In some cases emergency power
is necessary for motors that rewind
breaker spring sets, and other tasks
requiring AC voltage. For the latter,
uninterruptible power supplies are
used, and these also require battery
banks. High-voltage substations
often have primary and back-up
battery supplies.
Battery testing at regular intervals
is a given, and incoming inspection is
also necessary. However, there is also a
need for battery monitoring to provide
a continual check. Battery monitoring
relies on cell voltage, string voltage,
string current and battery impedance
measurements. The latter type of
testing is particularly useful for UPS
battery banks.
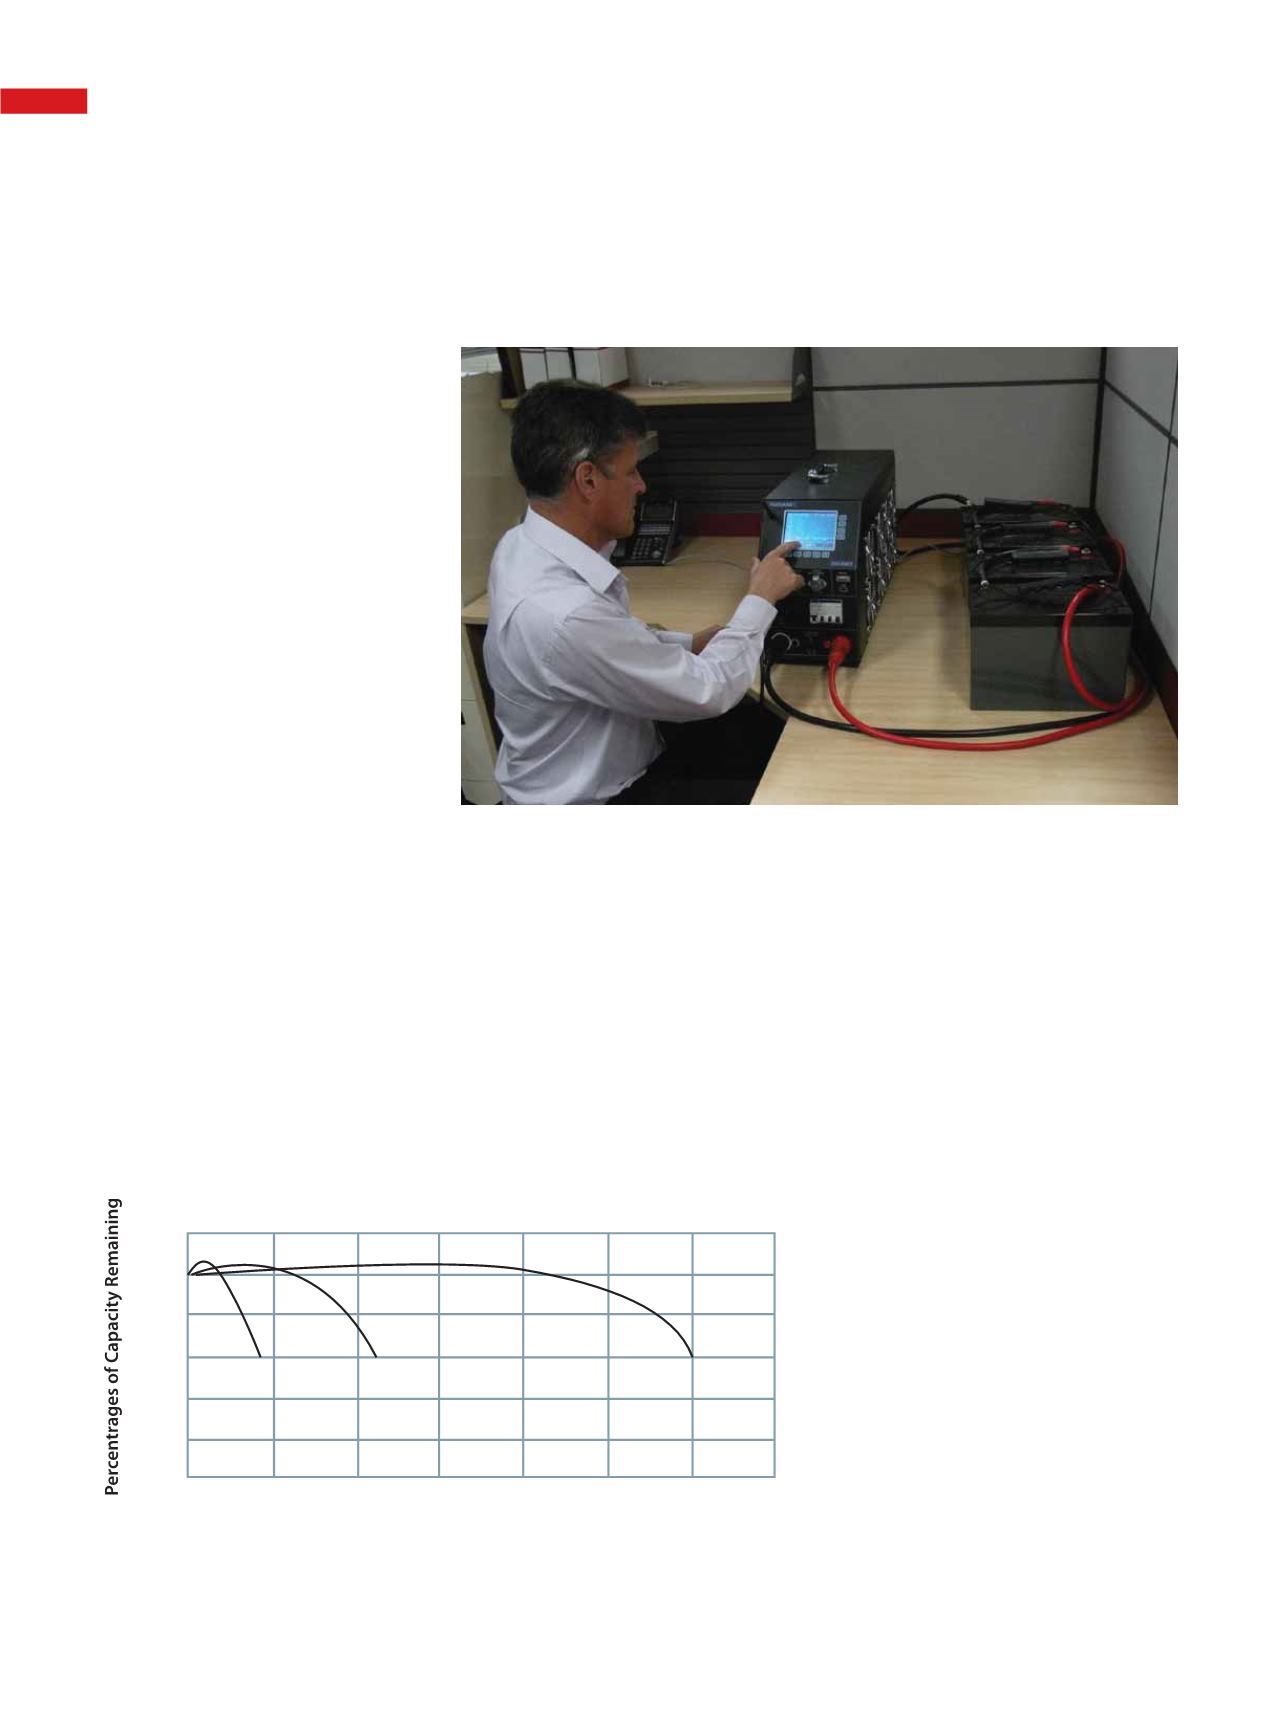
Figure 1 illustrates a discharge
tester suitable for lead-acid cells.
The apparatus allows for constant
current, constant resistance and
constant power discharge. Individual
battery voltage is monitored during
the discharge.
The batteries used in substations
are flooded cell (VLA), valve regulated
BATTERY TESTING AND
CHARGING FOR SUBSTATIONS
AND ELECTRIC TRACTION CAN BE
CHALLENGING.
PHIL KREVELD
DELVES INTO THE DETAIL.
Number of Cycles
(AH%)
100% O.O.D.
50% O.O.D.
30% DEPTH OF DISCHARGE
0
0
20
40
60
80
100
120
200 400 600 800 1000 1200 1400
Figure 1: The state of charge of VRLA batteries being checked on an IDCE840 battery
tester. Image courtesy of Power Parameters.
Figure 2: Lifetime Curves (Cycles).
LET’S GET TECHNICAL